Continuation candlestick patterns indicate that the current trend is likely to persist after a brief consolidation, provided a breakout is confirmed. These patterns are crucial for traders using technical analysis to anticipate trend continuation and optimize entry and exit points.
Unlike reversal patterns, which suggest a potential change in trend direction, continuation patterns emerge within an ongoing trend. Recognizing these formations allows traders to capitalize on sustained price movements.
Powerful Continuation Candlestick Patterns
In this guide, we’ll explore key continuation candlestick patterns that can enhance your trading strategy.
Table of Contents
- Doji
- Spinning Top
- Rising & Falling Three Methods
- Tasuki Gap
- Mat-Hold
- Rising & Falling Window
- High Wave
1. Doji
A Doji candlestick has a small or nearly nonexistent body, where the open and close prices are close to each other. It represents market indecision between buyers and sellers.

When appearing in an ongoing trend, a Doji suggests a brief pause or consolidation, after which the trend may resume.
2. Spinning Top
The Spinning Top pattern features a small body with long upper and lower shadows, signaling uncertainty and equilibrium between buyers and sellers.

If followed by a confirming candle, a Spinning Top can indicate the continuation of the prevailing trend.
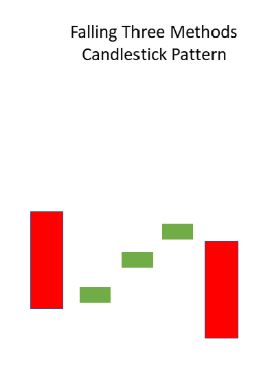
3. Rising & Falling Three Methods
This pattern consists of multiple candlesticks that depict a short consolidation phase within the dominant trend:
- Rising Three Methods: Appears in an uptrend, with three small bullish candles (or Dojis) followed by a strong bullish candle, confirming the continuation of the uptrend.

- Falling Three Methods: Occurs in a downtrend, featuring three small bearish candles followed by a strong bearish candle, indicating that the downtrend will likely continue after consolidation.
4. Tasuki Gap
The Tasuki Gap is a continuation pattern involving two consecutive candles within a trend:
- In an uptrend, a bullish candle is followed by another bullish candle that gaps upward. The third candle, which is bearish, closes within the gap, confirming the uptrend continuation.

- In a downtrend, a bearish candle is followed by another bearish candle that gaps downward. A bullish candle then closes within the gap, reinforcing the continuation of the downtrend.

5. Mat-Hold
The Mat-Hold pattern begins with a long bullish candle within an uptrend. This is followed by a smaller candle (often a Doji) that signals slight consolidation or a pullback before another strong bullish candle resumes the trend.

This pattern suggests a high probability of trend continuation after a brief pause.
6. Rising & Falling Window
- Rising Window: Occurs when the high and low of the current candle are both higher than the previous period, forming a gap (or window). It signifies strong bullish momentum.

- Falling Window: Happens when the high and low of the current period are lower than the previous period, forming a downward gap, indicating strong bearish sentiment.

These gaps highlight significant momentum in the direction of the existing trend, reinforcing the likelihood of continuation.
7. High Wave
The High Wave candlestick pattern has a small body with long upper and lower shadows, indicating high volatility and market indecision.
- In an uptrend, a High Wave candle may suggest hesitation among buyers, potentially leading to a pause or reversal.

- In a downtrend, it may signal uncertainty between buyers and sellers, implying that the trend could either continue or reverse depending on future price action.

Conclusion
Mastering continuation candlestick patterns provides traders with powerful insights into market sentiment and price action. To increase the reliability of these patterns, traders should combine them with additional technical indicators such as volume analysis, trendlines, and moving averages.
Also Read: 35 Candlestick Patterns in Stock Market: A Complete Guide
Frequently Asked Questions (FAQs)
What are continuation candlestick patterns?
Continuation candlestick patterns indicate a temporary consolidation or pause within an ongoing trend, after which the price movement is likely to continue in the same direction. These patterns help traders identify ideal entry points within the dominant trend.
How do I identify these patterns on a price chart?
To spot continuation patterns, analyze the shape and sequence of candlesticks within a trend. Look for specific formations such as pennants, flags, or key candlestick patterns like Doji, Spinning Top, or High Wave.
Why are continuation patterns important for traders?
These patterns provide valuable insights into market momentum and price behavior. By recognizing them, traders can anticipate trend resumption, allowing them to make informed decisions about trade entries and exits for improved profitability.